• expired

Efergy Engage Hub Solo $59.95 and "Free Postage" during December

10

If you already had a energy monitor installed as art of the governement scheme this is a nice little upgrade, add this to your interest with the iPhone or Android app you can track your power usage much more efficiently.

The Bargain is "Free Postage" during December (Saving $9.95)

Below is the websites information

engage hub solo
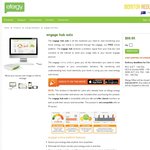
The engage hub solo is all the hardware you need to start monitoring your home energy use online in real-time through the engage, our FREE online platform. The engage hub recieves a wireless signal from your fuse box and connects to the internet to send your usage data to your secure engage account.

The engage online platform gives you all the information you need to make positive changes to your consumption behaiour. By monitoring and understanding how much electricity your home is using you can save energy and money.

NOTE: This product is intended for users who already have an efergy energy monitor. No transmitter and sensor are included when purchasing this product. The engage hub solo is compatible with your e2 and elite classic monitors as well as with their sensor and transmitter. This product is not compatible with an IR sensor.

engage online platform features
Access your energy data anytime, from anywhere
Eliminate bill shock, monitor your energy costs in real time
View your daily, weekley, monthly or average costs in easy-to-read graphics
Set your monthly budget and see how close you are to meeting it
Compare your energy over 12 months and see where your costs are highest
Choose to view your energy data in £'s, kWh or CO2
Discover and reduce your carbon footprint
Teach your family about energy use and saving
Use the engage hub solo kit to track reductions in your household energy
 

COMING SOON

Social Media widget - share your data with the online community
Energy Report - download your energy data onto your PC/Mac

    
Our engage hubs are simple to install and use. A small sensor is clipped on to the supply cables in your breaker panel. A lead from the sensor is connected to the efergy transmitter, which then wirelessly sends real time data to the home hub. The home hub is connected to your internet router via Ethernet cable. When you go online to our web portal or onto your smartphone app, the router wirelessly uploads your energy data and converts this data into kilo-watt hours. The web platform or app will then show you how much energy you are using in the same units that are on your bill. You can also see how much energy you are saving compared to other web platform users, compare energy saving tips, and set energy consumption targets.
Related Stores

efergy.net.au
efergy.net.au

closed Comments

  • -7

    during Dec

    Same prices a month ago, no bargain…

    http://webcache.googleusercontent.com/search?q=cache:ePXkeXd…

    • Is it cheaper than anywhere else including postage though?

      • -2

        who sells this item for more ?

        same price here.
        http://www.greentopia.com.au/Efergy-Engage-Hub-Solo/HH-1-AU.…

        this is not discounted, it's just advertising…

        • That one has shipping of $7.23. Making it $67.90

          So unless you can find a cheaper, then your negative is inappropiate

        • This post is 15% cheaper. 15% is too small?

    • Free Postage during December, so your not paying $9.95 in postage

      • -3

        then you might want to re-phrase the title if 'free shipping' is the bargain, because the price you posted is the normal price for this and has been for a while…

        • JV what are you on about, what does the heading say?

  • Being cheap i enter the daily KW data from my free Efergy Elite1.0R to Excel to produce the graphs etc. Spreadsheet calculates costs & CO2. Same result, just takes minutes per week.

    • I'm a lazy arse. Is this the best way to do it? I'm really after a historical power demand graph.
      It isn't compatible with my Efergy One, so I'd have to get the kit at 89 bucks.

      • It took about as much effort & time to post that as it takes to enter the 7 numbers once a week! If that is too much, enter the 7 weekly figures every 7 weeks for week to week rather than daily history.

        The advantage of the automated system is you can see hourly demand. Handy for identifying peak loads during a day. Especially handy if peak/off-peak meter fitted. My solution is for those who don't need that level of detail.

        I set up the spreadsheet based on Efergy's software. Did it to see if it was worth biting the unit. What I found was there was little interest after a month or so in the information. So unless you like playing energy auditor, it may not get much use.

        • Ahh yes, I actually meant an hourly power demand graph.

          Is there a better solution out there? This seems much much cheaper and more elegant than the EnviR as there's a smartphone app and the clamp is smaller as well.

          Ahah yes I realize I'll get bored of it after a while, I'm just a person who likes looking at numbers.

        • Someone else may answer that. I used the spreadsheet a few years back to see how useful data logging would be. I decided against buying (my phone's spellchecker keeps changing that to biting).

          In a small household it was easy to identify the (regular) energy hog appliances & times of use. (AC, clothes drier, cooking - which were obvious before data collection. Simply concentrated effort on minimising use.)

          Keeping too much data caused arguments as an intrusion on the family! That was not what I had considered when I started the process. Agreed to delete the data for family harmony!!

        • No worries, thanks. :)

        • If they pay the bills they can have a say.

          At end of day, I like to know how much power areas, appliances cost to run, it help work out if should keep them or replace them with more energy efficient ones. A lot of things can be moved to different hours, like washing to night time etc. and this helps focus on those type of activities without spending all your time looking at meter box and doing up spreadsheets that only cover a daily usage not detailed

        • Seems you misunderstand the functions of this data logger. It only gives a more detailed view of total household electricity consumption & presents it in more readable forms. You can look at your existing Efergy meter to see this data over a day.

          This deal will not give details about individual applance power use, just total power use. You would need multiple power sensors in different circuits for that (installed by an electrician at quite a cost), but that still does not give individual appliance consumption.

          Installing individual power meters on major applances will give that info. As many applances have an almost constant drain - consumption depends on amount of time the unit is on, so producing graphs of historical data is really a waste of time. Power meters only are needed for a short time per appliance, cost little, and can be borrowed in some places (neighbourhood centres).

          Similar to the software in this deal, I correlated BOM temperature data with power consumption, via the spreadsheet. Have been collecting consumption data in various installations due years. Nearly all household I visited with energy meters installed did not use them past the first months.

          Collecting data over many weeks proved to me the very limited value of the exercise in the home. Minute to minute charting of consumption is of little benefit, except to satisfy control freaks & nerdie obsessives! Its the amount of use & consumption of individual appliances that is important, not total household consumption, to reducing consumption. This data logger is unlikely to help. Knowing the approximate hourly consumption of each appliance, and taking a walk to see which are on, is the easiest way to control excess energy consumption. Always start with the major consumers.

        • I'm just a person who likes looking at numbers

          I am similarly afflicted!

        • Smart meters that bill by demand times, are a way off for Brissie.

          As you already know washing (who consumes much doing that?) could be done in off-peak times (10pm-7am http://www.savepower.nsw.gov.au/Portals/0/docs/news/Media071…). But who has to wash at peak times (2-8pm)? Modern washing machines have delay settings, so they can operate at off-peak times.

          most washing machines only use 50-150 W/load http://www.rpc.com.au/information/faq/power-consumption/wash… My washing machine (Fischer & Paykel Smart Drive) consumes 80 W/load. Compare that with a large screen TV watched for many hours a day in peak times!! (I time shift TV with a PVR & watch in off-peak on an efficient old & free CRT TV!)

          So as you are already aware, you don't need this deal to tell you anything new.

          Often the extra cost of replacing appliances ahead of time will never be recovered in energy savings. A better strategy is to buy the most energy efficient appliance (star ratings) & operate it in the most energy efficient manner - usually outlined in the manual. Again, no meter/graphs necessary.

          Refrigeration is a major consumer along with hot water. So good insulation saves energy/money (good seals on fridge, close door, correct loading of fridge space, thermal lagging of hot water pipes from tank, setting hot water to a lower temperature, etc).

          The most energy consuming appliances are the ones related to heating & cooling. So energy consumption rises with a temperature change (creating peak load times). Aircon or heating are major seasonal demands. But these should be obvious without a meter + data logging device. Look up any energy saving site for more suggestions. eg http://www.savepower.nsw.gov.au/households/power-saving-tips…

          I have spent years in energy conservation & design of research. Built my first data logger in the 70's, when installing off-grid photovoltaic systems. You really needed to understand energy consumption there, when expensive batteries, inverters & panels had to be balanced with a good understanding of potential energy demand.

          The best solutions are usually the least complex.
          You are already ahead of most people in understand at least some of those.
          (Star systems, efficient use & maintenance, off-peak use, knowledge of individual appliance energy consumption, etc - and this deal won't help with any of that!)

          CNet has an article on Power Meters & consumption http://www.cnet.com.au/power-consumption-how-much-are-your-g…
          eg 42-inch plasma TV 346W/hr. Thats equivalent to over 4 loads of washing in my washing machine every hour of viewing (most likely done in peak power times).

          I am not against gadgets (love them) but this one is over-hyped & under used in my experience.

    • This is more detailed like you can see what usage based on hours of the day

      http://www.efergy.net.au/index.php/au/community/

      • Some of those advantages are built into your existing Efergy meter, just not online

        List of features:
        - Online instant energy usage - read your portable Efergy's screen, just not online
        - Online historic daily, weekly and monthly information - again just read the screen under History
        What is coming:
        - Real-time alerts when exceeding a threshold of spend, refrigerator door open, appliance left on, etc. - just learn how to set the alarm on the existing Efergy meter

        Real features:
        - Visual and easy to read charts and graphs - the only real feature
        - Estimate your spend for the month with ‘your monthly budget’ widget.
        - Your city’s weather temperature and forecast displayed. - Wow!

        But hourly energy consumption seems only to be available for last 24 hours, as shown in the promotional video. To reduce peak loads (if & when smart meters come in), an hourly history for peak/offpeak is necessary to help you shift demand. But maybe those features will be built into the power box meters by then!
        eg in the future, smart meters will facilitate customers abilty to access electricity consumption information, using options such as internal home displays or via the web using on-line meter data applications. By being able to monitor daily consumption patterns, you can modify your behaviour to save money and help reduce greenhouse emissions. http://www.powercor.com.au/Smart_Meters/

Login or Join to leave a comment